
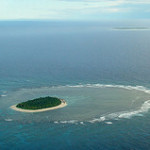
A nice visualization of seismic activity occurring under the Tongan Ridge and subduction zone. This animation was done after the magnitude 8 earthquake on May 6th, 2006. There are several layers going on here. First is the surface bathymetry where you can see the Tongan Ridge.
Next is the cross section of the velocity waves (P-waves) that show crustal density. The arc of blue is the seafloor of the Pacific Plate subducting beneath the Australian Plate. The yellow and red color is the less dense rock (due to heating by friction at the plate boundary), which is directly under the Tongan Ridge (and probably portion of the Kermedec Ridge to the south).
The last layer is the points where past seismic activity has occurred. Each cube represents an earthquake, with the large diamond the big one on May 6th, 2006. Note also how deep these earthquakes occur and how they follow the subduction trench.
Given the recent earthquake in the Kingdom of Tonga, I thought it would be neat to revisit this to get a sense of the area and how active it is!


What i find interesting about this is that there’s a concentration of boxes (earthquakes) near the top, the middle and just before the bottom. If that vertical distribution is representative of the physical world what the significance is there from this distribution? Anyone have an idea?
And re-reading what i just wrote makes me sound like a arrogant priss to myself. Sheesh. Ah well what else do you expect out of a lighting tech in Chicago.
The distribution of earthquakes actually corresponds to the boundary of the 2 plates, i.e. the subduction zone which is characterized by the blue arc moving downwards. Does that make sense?
Thank you that does make sense. However I was also wondering why there was 3 concentrations of earthquakes along the the arc. You can see these in the last 20 seconds of the video when they are doing the final pull out. Would that be an area where there is especially high friction, causing earthquakes?
Or maybe that is all in my head.
All in all thank you for taking this look at geology it’s very cool.
If you mean the three “clumps” in the vertical distribution, my understanding is that this is not a terribly unusual general pattern for a subduction zone, though Tonga is certainly special. The first cluster are “shallow” quakes caused by brittle bending of the oceanic crust and friction of the oceanic crust as it subducts under the crust which Tonga is on. The second intermediate cluster is where there is a further “bending” or downdip of the subducting plate, causing increased tension and compression faults(depending on top or bottom of plate) which causes earthquakes. The last set is deep quakes, which are thought by some to be phase change quakes as the remains of the oceanic crust undergo massive heat and pressure caused phase changes.