
Make no mistake about it — I am shamelessly pimping out our lab’s new paper, written by yours truly. In fact, the title of this blog post was actually an alternate name for the manuscript (although I’d love to see the reviewer comments on that title).
Technology is absolutely ridiculous these days. My iPhone is a camera, radio, GPS, PDF library, guidebook, jump drive, online store, and even lets me board airplanes with a QR code. Ridiculous! How did I ever LIVE without this wonderful device??? Do you think it would it be legal to marry my phone?? Can my iPad be the godfather of our cyborg offspring?? Uh..I mean–*ahem*–I digress…
Most people don’t realize that scientific technology is equally ridiculous these days. I’m talking, of course, about the power of high-throughput sequencing. Machines which can now churn out hundreds of millions of DNA sequences in a single run–enough data to piece together a species’ genome sequence. I can spend a couple hours in the lab, ship out a tube of liquid, wait a few weeks, and then get answers to questions that have stumped biologists for centuries: What is a species? How many species are there? For microbes, does Everything live Everywhere?
This last question in particular has been incessantly wracking our brains. It all started in 1934 when Lourens Baas Becking came up with the brilliant insight (probably over beer) that microscopic species must have global distributions, since their small size enables easy, widespread dispersal. [One theory is that microscopic taxa get stuck to birds’ feet and can be globally dispersed during annual migrations.] If you use traditional taxonomy (morphology) to look at species under the microscope, this assumption generally hold up for organisms <2mm. Now, it seems pretty crazy that worms from California and Antarctica are the same species just because they look the same–it’s difficult even for humans to travel that distance, never mind some puny microscopic creature. Cue the advent of molecular methods: once we started getting gene sequences from individual ‘cosmopolitan’ species, the Baas-Becking hypothesis started to break down in most cases. Things that look the same–but live far apart–tend to have distinct gene sequences.
This approach worked for a while, but as you might imagine it is very time consuming to look at species on a case-by-case basis. The question is “is EVERYTHING everywhere”, not “are a couple things everywhere”. So we needed technology that could look at whole communities of microscopic species–technology that could do this quickly and comprehensively. Let the clouds part and sunshine stream down: 454 sequencing provided the golden solution in our recent Molecular Ecology paper.
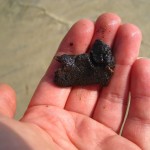
Using samples from deep-sea and shallow water ecosystems, we sequenced two diagnostic regions of the gene encoding the small subunit of the ribosome (commonly known as the 18S rRNA gene) from pretty much all eukaryotes present in the our sediments. Although our study focused on a small set of samples, the depth and geographic location of our sites allowed us to ask some big questions.
How diverse are eukaryote communities? Pretty damn diverse. Even with 1.2 million sequences, our rarefaction curves never reached asymptote–a big sequencing effort still failed to record all the species which probably exist our marine sediment samples.

What are the patterns of species distribution in the deep sea? That’s a very good question, and we’re still not sure. Our sample set was pretty limited and we didn’t look at community patterns over enough space (e.g. different sediment cores within a site) or time (seasonal, annual, etc. variation in communities) to be able to build up a robust picture. [Don’t worry though, this is next on my to-do list.] In this study, what IS apparent is the complex nature of species distributions in the deep sea. In the figure below you can see that the proportions of taxa varied widely across samples, and geographic proximity didn’t seem to correlate with similar microbial eukaryote communities. Pacific sites 422 and 528 had similar community assemblages (supported by multiple analyses) despite being separated by 400km and 1000m in depth. Pacific sites 321 and 422 are physically closer (only 36km apart), but show distinctly different abundances of major eukaryote groups. What drives these differences? We’re not quite sure, but I would suspect food input and level of disturbance. Our Atlantic deep-sea samples were collected in canyon ecosystems off the coast of Spain (lots of underwater mudslides!), and these samples show lower nematode abundances on average compared to Pacific sites.

Is Everything Everywhere? Nope. But some things have very innnnteresting–potentially cosmopolitan–distributions. A subset of taxa appeared to be present across ocean basins and depth gradients, although this subset represented a very small proportion under the most stringent parameters for data analysis (clustering Operational Taxonomic Units at 99%). We suspect that these putatively cosmopolitan taxa may have specific life history traits that enable them to disperse across large distances–my Ph.D. thesis work previously suggested that Enoplid nematodes are one such awesome group that gets around (if you know what I mean…).

What factor separates eukaryote communities – depth or distance? Depth! Only a infinitesimal proportion of taxa seemed to live in both deep-sea and shallow water sediments. These community differences became even more apparent when we incorporated sequence data into an evolutionary (phylogenetic) tree. Using the Unifrac distance metric (which traces the distance on the tree for species present in different samples), we can compare entire species assemblages across different sites. For whole eukaryote communities (fungi to protists to nematodes), deep-sea sites that were in completely different ocean basins, and separated by 10,000km, showed much more similarity versus shallow water sites that were more geographically proximate. This result completely blows my mind. I mean BLOWS my mind. Right now, we have a couple ideas that might explain these data. Firstly, maybe there’s less of an age gap between deep-sea sites, and the deep/shallow divide is a much more ancient in evolutionary terms. That is, deep sea species haven’t had contact with shallow water species for a VERY long time, but communities in the deep sea have been only been physically separated for a short time–and the gene data is giving us this signature. Secondly, maybe the patterns are reflecting the evolution of the ribosomal gene itself. Given that the deep-sea is cold, dark and food-limited, this might slooooooowwww everything down. It might take longer for mutations to build up in these species’ DNA, so the deep sea communities appear to be closely related at the genetic level even though they may actually have been separated for millions of years.

Our study used a fairly conserved gene (ribosome is a pretty important piece of cellular machinery, and you can’t make proteins if the 18S rRNA gene gains mutations that render the ribosome nonfunctional) that doesn’t necessary give us enough information to separate species. We’ll need to continue this work using more rapidly-evolving genes (such as those located in the mitochondrial genome) that can tell us more about populations of individuals. Species that diverged recently in evolutionary time, say only a couple million years ago, can potentially retain extremely similar copies of 18S genes if there has not been sufficient time to accumulate distinct mutations.
High-throughput community analysis is a VERY new field–there are a lot of techniques that need perfecting and we have many questions that must be answered, in terms of fieldwork (how we collect samples), lab work (how we extract DNA from these samples), and computer work (the algorithms and computational pipelines we use to process millions of DNA sequences in our quest to “do biology”). The figures and data ultimately represent a snapshot in space and time–a seriously, mega-exciting snapshot.
Reference:
Bik, H. M., W. Sung, P. De Ley, J. G. Baldwin, J. Sharma, A. Rocha-Olivares and W. K. Thomas (2011)Metagenetic community analysis of microbial eukaryotes illuminates biogeographic patterns in deep-sea and shallow water sediments. Molecular Ecology, doi: 10.1111/j.1365-1294X.2011.05297.x.


Awesome stuff! You’re rarefaction curves are a passion of mine. There are several models and not all of them are asymptotic. We found that parasite diversity (and diversity in general) on coral reefs often follows log models that don’t have asymptotes, and that’s chalked up to a seemingly never-ending supply of rare species that will continue to show up in samples over any reasonable time scale, thereby stubbornly preventing your curve from flattening off. This, in itself, is an interesting result and, frustratingly, could prevent a robust estimate of richness other than saying “it’s really high!”
Great stuff!