

Hale County in west central Alabama and Bamberg County in southern South Carolina are 450 miles apart. Both counties have a population of 16,000 of which around 60% are African American. The median households and per capita incomes are well below their respective state’s median, in Hale nearly $10,000 less. Both were named after confederate officers–Stephen Fowler Hale and Francis Marion Bamberg. And although Hale’s county seat is the self-proclaimed Catfish Capitol, pulling catfish out of the Edisto River in Bamberg County is a favorite past time. These two counties share another unique feature. Amidst a blanket of Republican red both Hale and Bamberg voted primarily Democratic in the 2000, 2004, and again in the 2008 presidential elections. Indeed, Hale and Bamberg belong to a belt of counties cutting through the deep south–Mississippi, Alabama, Georgia, South Carolina, and North Carolina–that have voted over 50% Democratic in recent presidential elections. Why? A 100 million year old coastline.

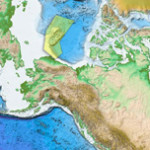
During the Cretaceous, 139-65 million years ago, shallow seas covered much of the southern United States. These tropical waters were productive–giving rise to tiny marine plankton with carbonate skeletons which overtime accumulated into massive chalk formations. The chalk, both alkaline and porous, lead to fertile and well-drained soils in a band, mirroring that ancient coastline and stretching across the now much drier South. This arc of rich and dark soils in Alabama has long been known as the Black Belt. But many, including Booker T. Washington, coopted the term to refer to the entire Southern band. Washington wrote in his 1901 autobiography, Up from Slavery, “The term was first used to designate a part of the country which was distinguished by the color of the soil. The part of the country possessing this thick, dark, and naturally rich soil…”

Over time this rich soil produced an amazingly productive agricultural region, especially for cotton. In 1859 alone a harvest of over 4,000 cotton bales was not uncommon within the belt. And yet, just tens of miles north or south this harvest was rare. Of course this level of cotton production required extensive labor.

As Washington notes further in his autobiography, “The part of the country possessing this thick, dark, and naturally rich soil was, of course, the part of the South where the slaves were most profitable, and consequently they were taken there in the largest numbers. Later and especially since the war, the term seems to be used wholly in a political sense—that is, to designate the counties where the black people outnumber the white.”

The legacy of ancient coastlines, chalk, soil, cotton, and slavery can still be seen today. African Americans make up over 50%, in some cases over 85%, of the population in Black Belt counties. As expected this has and continues to deeply influence the culture of the Black Belt. J. Sullivan Gibson writing in 1941 on the geology of the Black Belt noted, “The long-conceded regional identity of the Black Belts roots no more deeply its physical fundament of rolling prairie soil than in its cultural, social, and economic individuality.” And so this plays out in politics.

This Black Belt with its predominantly African American population consistently votes overwhelmingly for Democratic candidates in presidential elections. The pattern is especially pronounced on maps when a Republican candidate has secured the presidency as Bush did in 2000 and 2004. In Southern states where a Republican secures the nomination, almost the entirety of Black Belt counties still lean Democratic. This leads to a Blue Belt of Democratic counties across the South. Even when Clinton, a Democrat, overwhelmingly took most Southern states, the percentages of those voting Democrat was still highest in the Black Belt counties.

But the Black Belt has not always been visible on maps during elections. The Voting Rights Act, outlawing discriminatory voting practices, was passed in 1965. As result, a year earlier in the 1964 elections larger numbers of African Americans were excluded from the polls in Southern states. And, in turn, the blue band we see today was not visible.
Long heralded as the Black Belt for rich dark soils and later for the rich African American culture and population, it may equally be referred to as the Blue Belt to reflect both its oceanic geology and the political leanings that resulted from it.
Share the post "How presidential elections are impacted by a 100 million year old coastline"


Just saw this as well. Highest incidence of Diabetes in the USA also map on the Black Belt
This is the coolest thing I’ve read all week. Nice work.
+1 to what Andrew said. Awesome post!
Thanks guys
Awesome post! We’ll make a geologist out of you yet…
I agree this is some awesome science/Polisci!
Fascinating article! Very informative!
Indeed. Amazing and so innovative and creative! A new field is born: GeoPolitics. in the real sense: combining geology and geography. – jb
The map shown above does not appear to match the 2008 election results reported elsewhere, for example Wikipedia or the actual NYT page.
It may be showing something, but it’s not showing “2008 Presidential election results by county.”
Disregard and/or delete my inaccurate post above. Sorry for the confusion, which I assume was mine.
If you haven’t yet, you should do a comparison of oil deposition locations and how those states vote in relation to the interior sea! You might have to look at older seaways too (Pennsylvanian/ Mississippian) for the eastern oil fields. More oil=typically more republican tendencies!
For an interesting follow-up: how do congressional districts line up with the Black Belt? I am curious if there are signs of systematic gerrymandering.
Facinating! I’m guessing the efforts by the republicans to constrict voter rights would run very heavily along that geological “fault line”. Its analogous to sending US soldiers to war and when they return in need of help, back are turned. So is it that when cotton need picking, slavery was “born” in America and now that the slaves are “free”, they are further subjugated. Its reverse humanity. Thanks for clarifying the prism thru which our vision of the past and present seems to have difficulty peering.
Since the Iron Age England has been divided into the north and the south as well, with the dividing line known to geologists as the Jurassic Way. (http://www.southampton.ac.uk/~imw/jpg-Geological-Maps/8GB-Old-Map-British-Isles.jpg) You’ll probably find a lot of very old social and political divisions dependent on even older geological divisions. (Wasn’t there something about the recent Tunisian rebellion being divided on the same geographical divisions as the ancient Roman limes?)
You know how to make your crazy father-in-law happy!
This article is really interesting, but I’ve got to nit-pick. The second-to-last paragraph needs serious revision. Aside from some awkward phrasings, it’s fallacious. The disappearance of the political trend in 1964 was not a “result” of the Voting Rights Act in 1965. Causality doesn’t worth that way. The Voting Rights Act caused the band to appear by eliminating (more or less) disenfranchisement of blacks at the voting booth. I still understood your meaning, but the way you phrased it distracted me from the awesomeness of your article.
How intriguing! I love it when otherwise unexplained phenomena is examined through out-of-the-box thinking. Have you read Outliers by Malcolm Gladwell?
Wow. Way to rip off someone else’s research: http://www.vigorousnorth.com/2008/11/black-belt-how-soil-types-determined.html
Observer,
Actually what inspired this post was Geology and the Election 2000 by Professor Dutch and linked throughout the article. A friend who was a geologist turned me on to Dutch’s website. That website was created in 2002. After this article was written and searching for maps, I stumbled across the website you mentioned published in 2008.
I am grateful for Dutch’s research on this and take no credit for the novelty of the idea. I simply present here as a narrative.
Funny how, while Craig’s piece exhaustively cites the earliest iteration of this idea (at least on the internets), Observer’s links do not. Who’s ripping off who’s research here?
On another note. How could this be? I tyhought humans were responsible for rising sea levels
Fascinating to me how the maps show the ancient coastline curling through what is now Texas — and defining cotton-growing areas there, too. Not only is geography destiny, but geology and ancient geography are destiny. There’s got to be a great lesson in there for high school history, or government, or human geography, or all of them.
Now tie in bacterial soil composition, oxide deposits, archaic trade in fossils, maybe there is a politic of the soil, but the mother is the deep blue sea. That old translation was the Spirit was brooding over the Waters, in the sense of a kind of birthing. Maybe one thing really does lead to another, in the logic of the dreams of the deep blue sea.
A higher incidence of diabetes can be attributed to a diet higher in starchy, greasy, and salty foods. They are dipping those catfish in batter and frying them.
poverty = disease …
Lots of guys have already said that but I’m gonna repeat anyway: Great post. Keep looking for such a strange connections
To trace the coastline’s effects on human culture further back through (pre)history:
Charles C Mann’s 1491 mentions research indicating that the Mason-Dixon border, between slave and free states in the Civil War, roughly follows pre-existing boundaries between pre-Columbian cultures that practiced slavery and those that did not.
If that’s true probably the fertile soils created by the former coastline influenced this boundary for Native Americans as well.
Dr. M,
Awesome article. I have taken the liberty to post a link to your article on my associations website, http://www.PAPSS.org. The PAPSS Board represents about 150 professional soil scientists that work in Pennsylvania and some neighboring states. The soils that you refer to may be classified as the soil order “Mollisols”, and we are very familiar with the depositions that eventually became limestone. For some added fun, I may go to the USDA’s web soil survey page, where you can map soils based on a huge range of selection criteria. It just may be that the Mollisols will follow those same geographic boundaries that your maps have already done a great job of showing the relationships.
Update – I just checked the mapping of Mollisols and there is really no correlation, as that soil order is classified based on what we call the epipedon, or upper few feet of the soil profile as opposed to the parent material, which is the determining factor in the depositional environment of the ancient coastline. In any event, cool stuff and thanks again for the article.
This article is all wrong. The residents of those areas know the earth is only 6000 years old.
Incredible analysis and so topical.
I hate to be a smarty-pants (no wait, i love that!)but geologists have noted such things as long as maps were made. The US was settled by Europeans as a resource colony and most resources follow geological patterns. In addition to this pattern there is the Fall Line, which defined the location of the major Colonial manufacturing centers and subsequently, the cites of the Atlantic seaboard. The Rio Grande Rift in NM defined the easiest path for conquest and colonization of that state, hence El Paso-Mesilla-Albuquerque-Santa Fe and the pueblos that preceded them. And there’s more . . . Daniel Hillel at U Mass wrote a great book on such matters, Out of the Earth: Civilization and the Life of the Soil.
Interesting article. To those that find this sort of info interesting you might consider reading the books of John McPhee…such as “Rising From The Plains”, “In Suspect Terrain”, “Basin And Range”….and the Finale…”Assembling California”. They are worth the time to us geological types that also enjoy geology’s intersection with history.
(“The control of Nature” is also very good).
Democratic Party = Party of Slavery and oppression, 200+ years and counting
The Black Belt was actually visible on election maps before 1964, just in the opposite way. As V.O. Key’s classic “Southern Politics in State and Nation” about 1900-1950 shows, when blacks were excluded from voting, the Black Belt was the center of the most virulent supporters of segregation among whites (since those whites were outnumbered by the oppressed blacks). As a result, votes in state primaries reflected that, as their votes more often went towards the most racist candidate. Also, those same counties voted (again, with only the whites voting) most often for the Democratic candidate, whereas the other countries, with less of a “black threat” had more voters who dared vote Republican, even in the Solid South.
A clearer example of idiocy masquerading as curiosity couldn’t be manufactured.
Absolutely. However, the change between 1964 & 1968 wasn’t due to enfranchisement of blacks, it was due to the break up of the “Solid South”.
Because the black belt affects the appearance of the land from the air, the wide circular swath from northeast Mississippi through central Alabama is clearly visible on Google Maps satellite view.
The soils that match are udalfs and uderts (humid deciduous forest soils and humid shrinking-swelling clay soils). I’ll post again if I can find some good soil maps.
Crud – I thought I posted links, but they never showed up. My apologies if this becomes a double post.
http://soils.usda.gov/technical/classification/orders/alfisols_map.html
http://soils.usda.gov/technical/classification/orders/vertisols_map.html
http://soils.cals.uidaho.edu/soilorders/percentalf.gif
http://soils.cals.uidaho.edu/soilorders/percentvert.gif
Truly fine and eye-opening article. Thank you for the deep insight.
“Insanity is repeating the same mistakes and expecting different results.”
— Narcotics Anonymous (1981).
This is very cool. Thanks for sharing.
Thanks for the compliment Carl.
I noticed that too. I had thought about posting a Google map but was trying to overwhelm people. Thanks for mentioning this John.
John,
Interesting. Thanks for sharing and explaining.
Now on my to read list!
I am never claimed this was a novel or idea (or even my own) but rather just an interesting pattern. Indeed, like any species, humans are impacted by our environment both biologically and culturally.
Bummer, that would have been interesting to see. Thanks for sharing among your colleagues.
Great article, really enjoyed it :)
One small suggestion would be to reword the penultimate paragraph though. The 1964 election results were not a result of the 1965 Voting Rights Act. I only point out to be helpful, not critical.
a possible view of america of the future,a geological future that is.
It took me a while to figure out that the “blue band” you describe just above and below the map are not the colours in the actual map and that the blue in the map is actually the republican votes. It’s altogether more confusing because there *is* a blue band on the map right where you describe where the black belt is and where the “blue band” shows up in later elections, but in that specific election there was no “blue band” as evidenced by all the blue on the map! I’m still not 100% certain I’ve interpreted everything correctly.
I guess what I’m saying is, you might consider switching the colours on the map.
Hmmmm.
Would you also say this: “He was born in 1965. As a result, his parents had sex nine months earlier, in 1964.”
I Can Has Cauzality?
for Mandy36519… I recommend a course in Earth history… from PreCambrian to the present…
Dude, southern food is goooood.
Brilliant piece of work! This article is intriguing, informative, and explains a lot.
Now referred to on Wikipedia’s Reference Desk (in some sort of cycle of life, circle of reflection or hall of mirrors), but soon to be archived:
http://en.wikipedia.org/wiki/Wikipedia:Reference_desk/Humanities#Blue_Stripe_in_the_Red_South
That Wikipedia entry’s already been archived: the new URL is
http://en.wikipedia.org/wiki/Wikipedia:Reference_desk/Archives/Humanities/2012_September_2#Blue_Stripe_in_the_Red_South
Dr. “M”, what’s your full name? I can’t cite you properly for any work I’m doing without it.
https://www.deepseanews.com/about/mcclain/
Wow, fascinating to find out more about the nation‘s electoral history.
How does geography affect where they live
SOMEONE – “How does geography affect where they live [?]”
It clearly explains the connection in the article. You may want to read it.
Dr. McClain – Excellent piece! Thank you for posting. Always fascinating to make such connections that we typically do not see.