
Well it could be any species. Anglerfish, carnivorous sponge, giraffe, or even a montane unicorn.
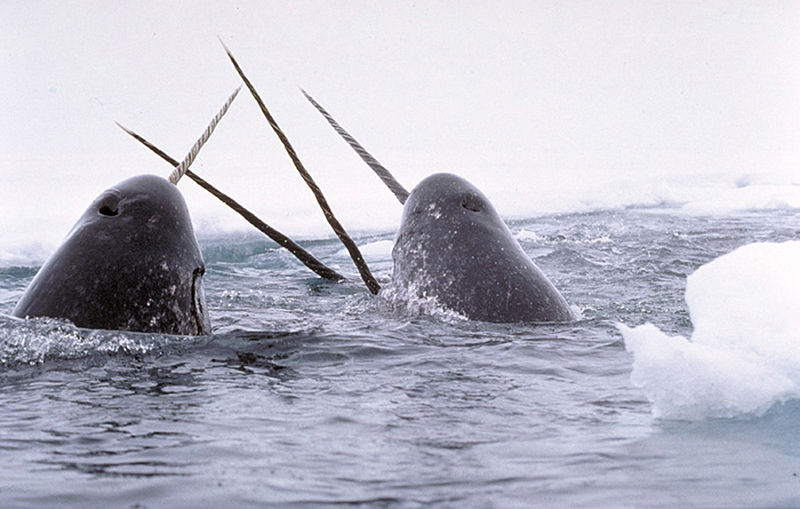
BUT I WANT TO WRITE ABOUT THE NARWHAL! NOBODY CAN STOP ME!
MWAHAHAHA
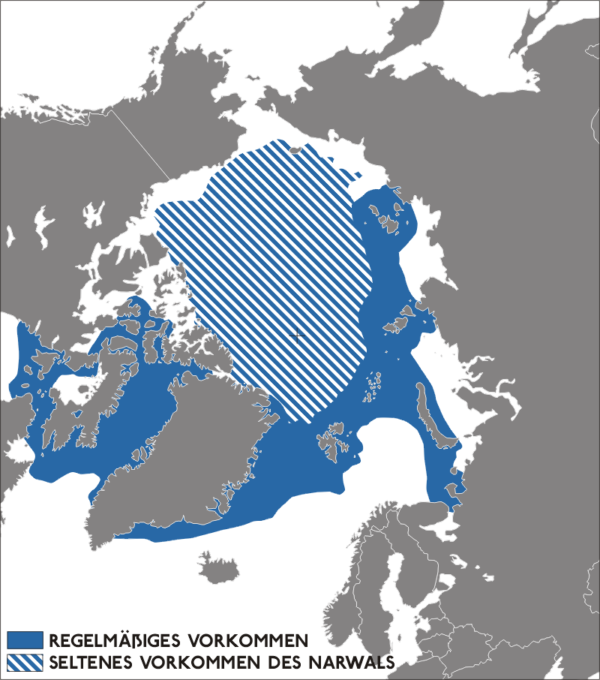
Let’s assume that once a species gets closer and closer to this geographic limit it is getting closer and closer to some aspect of the environment that is intolerable for them. For our Narwhal, too far South the temperature is uncomfortably warm. This happens with each of its boundaries on the north, south, east, and west sides. But the center of that geographic range is prime position. Everything is just right. The perfect balance. A Goldilocks scenario. At this place the Narwhal flourishes and the number of that Narwhals is spectacular. This is the Abundant Center Hypothesis. A species is most abundant at the middle of its range. And in the case of our Narwhal, we should find the most of that horned, blubbery beauty right smacked dab in the center of its geographic range.
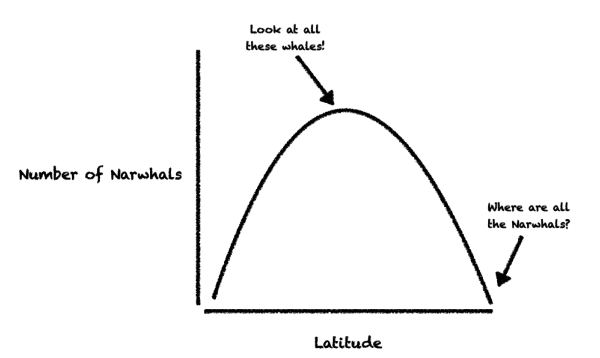
Graphically, you can think of the Abundant Center Hypothesis as normally distributed bell curve (see above). Pick one of those geographic or environmental axes like temperature or latitude and at the center is peak density or abundance for that organism.
But how well does this actually work in the wild among all animals and plants?
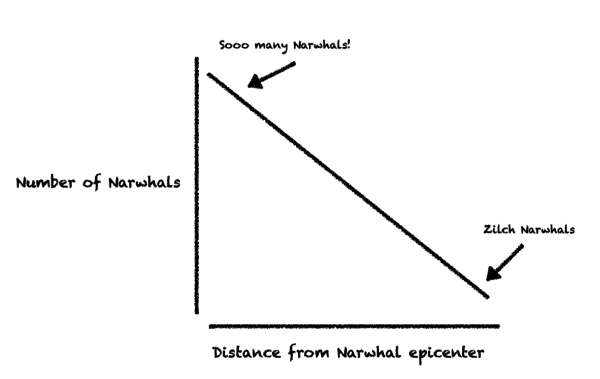 New work by Tad Dallas, Robin Decker, and Alan Hastings at the University of California, Davis sheds some new light on this almost 40-year old question. They recast the Abundant Center Hypothesis into a new testable relationship, if a species is most abundant at their range center, then a negative correlation should exist between abundance and distance from the center—a distance-abundance relationship (above illustration). Overall, the group of scientists examined this relationship for 1,109 birds, 63 fish, 81 mammals, and 166 trees in the Americans.
Overall, distance-abundance relationships like in the figure above were rarely observed. For birds, only 123 out of 1,109 species displayed a negative distance-abundance relationship as predicted. Moreover, 151 birds displayed the exact opposite pattern, their abundances actually increased away from their center. For fish, mammals, and trees combined only 13 negative relationships were found.
So what of the Abundant-Center Hypothesis? Alas, it may be time for the trash bin.
Recovering the predicted relationship for only 9.5% of the organisms tested isn’t exactly impressive. One glimmer of hope remains. The study by Dallas, Decker, and Hasting was for land dwellers. For my beloved Narwhal and other denizens of the sea, they may still be most bountiful at the centermost.


Wouldn’t the distribution be the same density in the areas in which none of the unfriendly characteristics are present enough to matter? E.g. if a creature can thrive equally well anywhere in a temperature range, and survive for several degrees hotter or colder, wouldn’t you expect the entire “thriving” range to be about equally dense, with the area from that range to the boundary populated by a logarithmically thinning population ending at zero as the survival boundary is reached? So a graph of numbers would be roughly the same throughout the “thrive” range, and declining population “edges” stretching to the survival boundary.
Graphing this could get quite complex if there are a number of habitat limitations, but in principle the “thriving” area, where none of the negative influences is important, should be fairly large and uniformly populated within the limits of random fluctuation.